The Anatomy of an HFT Strategy Lifecycle
Apr 22, 2026 - Tribhuven Bisen
From Signal to Simulation to Deployment
The Anatomy of an HFT Strategy Lifecycle
From Signal to Simulation to Deployment
A Practitioner's Walkthrough of Day-to-Day Quantitative Trading
T E C H N I C A L D E E P D I V E
Based on a conversation with Annanay Kapila Former Quant Trader at Flow Traders & Tower Research Capital | Co-Founder, QFEX
Introduction
High-frequency trading firms are among the most technically sophisticated organizations in the financial world. They employ teams of mathematicians, physicists, and engineers to build systems that can predict market movements on microsecond timescales and act on those predictions before anyone else. Yet surprisingly little has been written about what a quantitative trader at one of these firms actually does on a daily basis.
This article draws on insights shared by Annanay Kapila, a former quantitative trader who worked at both Flow Traders and Tower Research Capital before co-founding QFEX, a new exchange bringing perpetual futures to traditional equity markets. Kapila offers a rare, practitioner-level view into the end-to-end lifecycle of an HFT strategy: from the initial identification of an edge, through model training and high-fidelity simulation, all the way to live deployment and the ongoing work of diagnosing decay.
What emerges is a picture of trading that is far more engineering-driven and scientifically rigorous than most outsiders imagine. The best firms do not operate on gut instinct or chart patterns. They run systematic research pipelines that resemble those of a machine learning lab, with the critical difference that every model decision has immediate, measurable financial consequences.
A Day in the Life: Tower vs. Flow Traders
The daily rhythm of work at an MIT-style firm like Tower Research Capital is strikingly different from a Chicago-style firm like Flow Traders. Understanding this contrast reveals how the two philosophies manifest in practice.
| Dimension | Flow Traders (Chicago) | Tower Research (MIT) |
|---|---|---|
| Time Split | 70% live trading, 30% research | 70% research, 30% monitoring |
| Primary Activity | Adjusting parameters in real-time | Writing C++ code, training models |
| Coding Ownership | Developers implement tickets | Traders write production C++ |
| Decision Timing | During market hours | During research; strategies run autonomously |
| Market Focus | Nascent, inefficient markets | Efficient, high-volume markets |
At Flow Traders, Kapila spent roughly 70% of his time focused on the live market during trading hours, constantly adjusting parameters, strategy toggles, and position limits. The remaining 30% went to research, systematic analysis, and coding. The work was mentally exhausting because wrong decisions during live trading could immediately cost significant money.
At Tower Research, the ratio flipped almost exactly. Approximately 70% of the day was devoted to research, systematic model improvement, and writing C++ code for the trading strategies themselves. The remaining 30% involved higher-level decisions: evaluating which strategies were performing well, which to cut, how to respond to exchange changes, and how to adjust behavior ahead of special events such as data releases or holiday periods.
A critical distinction is code ownership. At Tower, traders were expected to write production-quality C++ themselves, rather than filing tickets for a separate engineering team. This tight coupling between the person who understands the alpha and the person who implements it eliminates a major source of latency and miscommunication in the development pipeline.
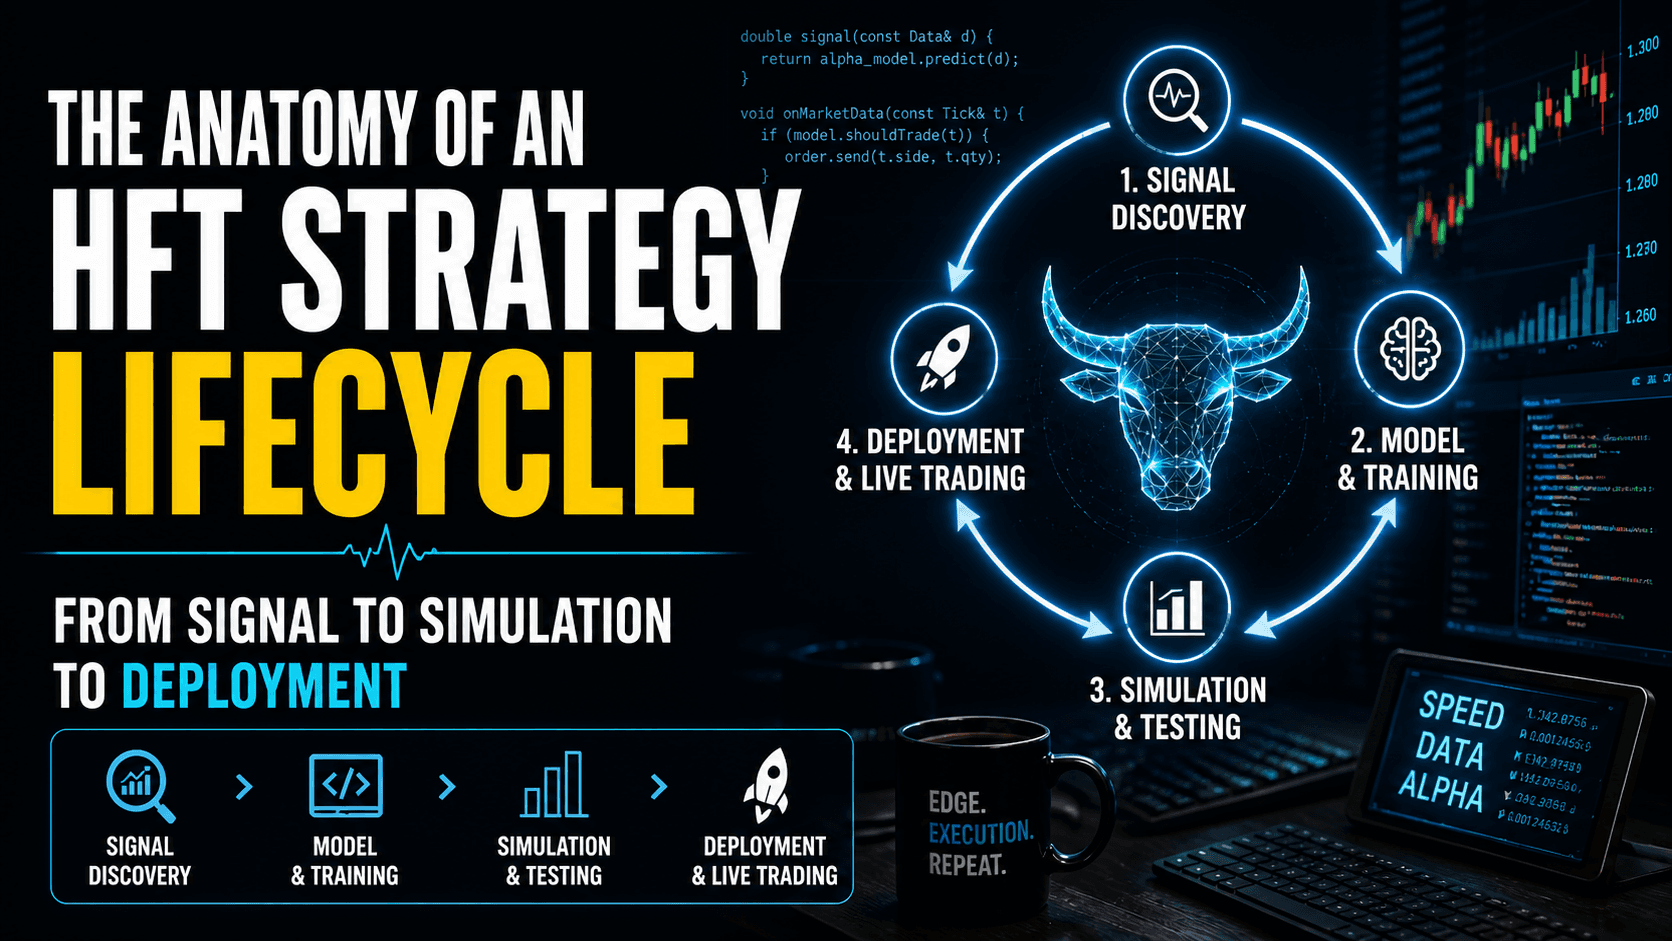
The HFT Strategy Lifecycle
The core of an MIT-style quant trader's work is the strategy improvement pipeline. This is a structured, repeatable process that mirrors the scientific method. Kapila describes a lifecycle with four distinct phases, each with its own tools, metrics, and failure modes.
Phase 1: Opportunity Identification
The first step is to systematically identify where money is being left on the table. Firms maintain automated scripts that continuously analyze performance data, looking for patterns in missed opportunities, underperforming strategies, or newly emerging market conditions.
The key questions at this stage are: Where are we losing money? Which opportunities are we missing? Have there been any changes in exchange behavior, market microstructure, or available data that create new openings? This is not a casual brainstorming exercise. It is driven by quantitative analysis of historical performance data, fill rates, and P&L attribution.
Opportunity identification feeds into two distinct improvement tracks. The first is model improvements: new mathematical insights about fitting the model better, new features that capture previously unmodeled market behavior, or new data sources. The second is execution improvements: reduced latency on order entry, more sophisticated ordering behavior, or better queue position management. Kapila estimates that execution work accounted for roughly 20% of his team's time, with the remaining 80% devoted to model and alpha research.
Phase 2: Hypothesis Formation and Model Training
Once an opportunity has been identified, the quant formulates a null hypothesis and an alternative hypothesis. The null hypothesis is that the existing system is already optimal. The alternative hypothesis is that a specific change, whether to the model, the features, the training procedure, or the execution logic, will generate additional profit.
This structure is important because it forces intellectual discipline. It is easy to convince yourself that a change is an improvement when you are looking at cherry-picked examples. The hypothesis-driven framework requires a rigorous evaluation of whether the improvement is statistically significant across a broad dataset.
Model training itself typically involves ingesting high-frequency market data, including order book snapshots, trade-and-quote data, and other proprietary signals, and fitting a machine-learning model that predicts short-term price movements. The output is usually a prediction of where the price will be in the next 100 milliseconds to a few seconds, along with a confidence estimate.
On very short time horizons, 100 milliseconds to a few seconds, model accuracy can be remarkably high because the prediction is driven almost entirely by order book dynamics: which orders are being placed, canceled, and executed. Kapila notes that R-squared values of 0.2 to 0.5 are achievable at these timescales, whereas a one-year price prediction might achieve an R-squared of only 0.1, and even that would be considered exceptionally good.
Phase 3: High-Fidelity Simulation
This is perhaps the most technically impressive and least understood part of the pipeline. Once a code change has been made and a new model trained, the strategy must be evaluated in a simulation environment before going live.
The simulation infrastructure at Tower was designed for exact alignment with the live trading system. This is a crucial architectural decision. Rather than building a separate backtesting framework, which inevitably introduces discrepancies with the live system, Tower used the exact same compiled trading binary for both simulation and production.
The simulation worked by connecting the live trading binary to a fake exchange process that replayed recorded market data. This recorded data was raw, timestamped data captured directly from the exchange, preserving the exact sequence and timing of every order, cancellation, and trade. The result was an environment that faithfully reproduced the conditions the strategy would encounter in production, including realistic latencies and order book dynamics.
The strategy was then run through multiple months of historical data. The quant evaluated a comprehensive set of metrics: P&L changes, Sharpe ratio, number of down days, fill rates, and other proprietary performance characteristics. Only if the improvement showed a statistically significant P&L change would the code be merged into the main branch and deployed in the next release cycle.
"We would basically set up our trading strategy, and it would connect to a fake process that was feeding the data as if we were getting it from the real exchange. It was not a separate backtester — it was the exact same trading binary with a fake exchange that replayed recorded data." — Annanay Kapila
Why This Architecture Matters
The decision to use the same binary for simulation and production eliminates an entire class of bugs. In many quantitative firms, a persistent source of frustration is discrepancy between backtesting results and live performance. These discrepancies arise from subtle differences in how the backtest handles order matching, latency simulation, partial fills, and edge cases. By using the exact same code path, Tower reduced this source of error to near zero, making the simulation results far more trustworthy.
Phase 4: Deployment and Monitoring
After a change has been validated in simulation, it is merged into the main codebase and deployed to production. But deployment is not the end of the lifecycle. Every strategy is subject to continuous monitoring through a battery of automated scripts that track key performance indicators in real time.
The monitoring infrastructure watches for early signs of strategy decay, which can be caused by any number of factors: changes in market microstructure, new competitors entering the same signal space, exchange-level modifications, or even regressions in the firm's own code. The goal is to detect problems early, before they manifest as significant P&L losses.
The remaining 30% of the quant trader's daily time is devoted to this kind of operational oversight. It includes responding to upcoming data releases (which may require temporarily disabling strategies), sizing strategies for expected volatility, adjusting ordering behavior around holidays, and handling other situational tweaks that are too infrequent or complex to automate.
Diagnosing Strategy Decay: A Systematic Approach
When a strategy's performance deteriorates, the quant must determine whether the problem lies in the model (the alpha has decayed) or in the execution (the alpha is intact, but the firm is no longer capturing it effectively). This diagnostic process is one of the most important skills a quantitative trader develops, and it follows a structured methodology.
Step 1: Evaluate Model Accuracy Out-of-Sample
The first step is to assess whether the model itself has decayed. This is done by comparing the model's accuracy during the training period with its accuracy on recent, unseen data. If the model reported 30% accuracy (measured by R-squared or other proprietary metrics) during training but is only achieving 5% accuracy on live data, the model has likely decayed.
Model decay can have two causes. Sometimes it is simply a case of the market shifting, and retraining the same model on new data is sufficient, because the model architecture is robust enough to learn the new patterns. In other cases, something has fundamentally changed in the market, requiring the quant to revisit the model structure, features, or training methodology.
Step 2: Investigate Execution Metrics
If the model accuracy is still consistent with training expectations, the quant shifts attention to execution-level diagnostics. The most revealing metric is fill rate: the percentage of aggressive orders that successfully get filled before the market moves away.
Kapila provides a concrete example. Suppose a strategy historically achieved a 50% fill rate on aggressive (liquidity-taking) orders. If that drops to 10% or 5%, it is strong evidence that a competitor has entered the same signal space with faster execution. Someone else is now trading on the same alpha, but getting to the exchange first.
At this point, the investigation shifts to exchange microstructure. Has something changed on the exchange side? Is there a regression in the firm's own C++ code that has introduced additional latency? Has the exchange changed its matching rules or network topology? These questions can be answered through systematic analysis of order-level timestamps and comparison against historical baselines.
Step 3: Analyze Long-Run P&L Per Trade
A subtler but critical diagnostic is to examine the long-run P&L of individual trades. A strategy might appear profitable at the moment of execution, but if the price consistently moves against the position after execution, the strategy is suffering from adverse selection. This means the strategy is systematically trading against informed flow, and the apparent profits at execution are an illusion that disappears over a slightly longer time horizon.
Monitoring the post-trade P&L curve over time, for example tracking the average P&L of a trade at 1 second, 10 seconds, 1 minute, and 5 minutes after execution, reveals whether the strategy is capturing genuine alpha or being adversely selected.
The Alpha-Execution Split
Several leading firms, most notably Citadel Securities, have formalized the separation of the trading pipeline into two distinct roles: alpha quants and execution quants. This organizational structure reflects the fact that the skills required to build a good predictive model are quite different from the skills required to turn that model's predictions into money.
Alpha Quants
Alpha quants focus on the modeling pipeline. Their job is to find predictive signals in market data, build features, train models, and evaluate prediction accuracy. They work primarily with historical data, statistical tools, and machine-learning frameworks. Their success is measured by model metrics: R-squared, information coefficient, decay profiles, and out-of-sample prediction accuracy.
The advantage of this separation is that model quality can be evaluated independently of trading P&L. A model might have excellent predictive accuracy, but the firm might be losing money because of poor execution. Separating the roles allows each team to be held accountable for their specific contribution to the pipeline.
Execution Quants
Execution quants focus on the execution layer. Given a signal from the alpha model that says the price is likely to move up, the execution quant's job is to design the order entry logic that captures that prediction at the lowest cost. This involves decisions about order types (limit vs. market), aggressiveness, latency optimization, queue position management, and how to minimize market impact.
Execution improvements tend to be more engineering-intensive than alpha improvements. They involve deep knowledge of exchange microstructure: how the exchange processes orders, where the order lands in the matching engine, how risk checks are performed, and how the order book is structured. This is the domain where latency in nanoseconds can make the difference between a profitable trade and a missed opportunity.
Model Accuracy Across Time Horizons
One of the most important and counterintuitive insights from quantitative trading is the relationship between prediction accuracy and time horizon. This relationship is central to understanding why different trading strategies exist and why the HFT industry structure looks the way it does.
On very short timescales, in the range of 100 milliseconds to a few seconds, predictive models can be remarkably accurate. Kapila reports that R-squared values of 0.2 to 0.5 are achievable. The reason is that short-term price movements are driven almost entirely by order book dynamics: the flow of orders being placed, modified, and canceled. This data is highly structured, available in real time, and feeds cleanly into machine-learning models.
Kapila draws an analogy to physics. On the smallest scales, string theory governs behavior. Zoom out to quantum mechanics, then to Newtonian mechanics at the scale humans experience. Each level requires different tools and different assumptions, but they all connect. In trading, the order book is the "quantum mechanics" — it governs very short-term dynamics with high predictability. At longer timescales, the drivers shift to news, macroeconomic conditions, and other factors that are far harder to quantify and model.
As the prediction horizon extends to hours, days, and months, model accuracy drops dramatically. A one-year price prediction model with an R-squared of 0.1 would be considered exceptionally good. At these timescales, the relevant data becomes much harder to collect and structure: earnings reports, geopolitical events, supply chain disruptions, regulatory changes. This is why longer-term trading, the domain of hedge funds, almost always involves significant human discretion, even at the most data-driven firms.
"Even very, very, very good shops, like Citadel Commodities, one of the most successful hedge fund units in the world of all time — they have almost nothing which is fully systematic. Almost all their money is made by systematic machine learning and alternative data fed to a portfolio manager, who then makes the decision." — Annanay Kapila
The Industry Shift: HFT to MFT
A notable recent trend is the expansion of HFT firms into medium-frequency trading (MFT), operating on timescales of minutes to hours rather than milliseconds. This shift is driven by two converging forces.
First, while HFT revenues continue to grow in absolute terms because overall market volume keeps increasing, the edge per trade is shrinking as markets become more efficient. Adding incremental revenue to an already mature HFT business is increasingly difficult. Starting an MFT business from scratch, by contrast, can grow from zero to hundreds of millions in revenue relatively quickly.
Second, recent advances in compute power have made it feasible to train far more sophisticated models than were possible even five or six years ago. XTX Markets, for example, famously operates one of the largest non-corporate, non-university supercomputer clusters in the world, housed in Iceland. This compute infrastructure has been a genuine unlock, enabling the kind of deep neural network training that makes medium-frequency prediction viable for the first time.
For HFT firms, the expansion into MFT is a natural land grab. They already have the exchange connectivity, the data infrastructure, the risk management systems, and the operational processes. The missing ingredient is talent: researchers who understand how to build models that work on longer timescales, where the signal is weaker and the noise is greater. This is why the industry has seen aggressive hiring of machine-learning researchers and PhD-level quantitative talent in recent years.
Lessons for Practitioners
Several principles emerge from Kapila's account that are relevant not just to HFT practitioners, but to anyone building systematic strategies.
Simulation fidelity is paramount. The decision to use the same binary for simulation and production, rather than building a separate backtester, is a powerful architectural insight. Any discrepancy between the simulation environment and the live environment is a source of false confidence. The closer the simulation matches reality, the more trustworthy the results.
Separate diagnosis of model and execution. When a strategy underperforms, resist the temptation to immediately blame the model. The Citadel Securities split between alpha quants and execution quants reflects a deep insight: the pipeline has distinct components, and each can fail independently. Diagnosing the right layer saves enormous time.
Monitor fill rates, not just P&L. P&L is a lagging indicator. Fill rates, post-trade P&L decay curves, and latency distributions are leading indicators that reveal problems before they show up in the bottom line. Building monitoring infrastructure around these metrics is as important as building the strategy itself.
Adopt a hypothesis-driven workflow. Every change should be framed as a testable hypothesis with a null alternative. This discipline prevents the accumulation of untested assumptions and ensures that each improvement is backed by statistically significant evidence.
The best discretionary traders are systematic about their discretion. Even outside the HFT world, the traders who survive multiple market regimes log their decisions, analyze their mistakes, and treat trading like a structured, data-driven discipline. The psychological dimension of trading is as important as the technical one, which is why firms like Citadel invest heavily in performance psychology.
Conclusion
The anatomy of an HFT strategy lifecycle reveals a discipline that is far more rigorous, scientific, and engineering-intensive than popular depictions suggest. The daily work at a firm like Tower Research Capital looks less like a trading floor drama and more like a machine-learning research lab, with the crucial difference that every experiment has immediate, real-world financial consequences.
The pipeline from signal identification to simulation to deployment is a well-oiled machine, refined over years of iteration. The firms that dominate this space do so not because they have one brilliant insight, but because they have built an industrial process for generating, testing, and deploying thousands of small improvements with high reliability.
As the industry evolves, with HFT firms expanding into medium-frequency trading and exchanges like QFEX bringing crypto-native innovations to traditional markets, the core principles of this lifecycle remain constant. Markets change. Models decay. Edges erode. The only sustainable advantage is the process itself: the ability to identify new opportunities, test them rigorously, deploy them quickly, and diagnose failures when they inevitably occur.
About the Source: This article is based on a podcast conversation between Tribhuvan and Annanay Kapila, recorded in February 2026. Kapila is the co-founder of QFEX, a Y Combinator-backed exchange building perpetual futures for traditional equity markets. He previously traded at Flow Traders and Tower Research Capital.