Backtesting Paradigms: Vector-Based vs Event-Based
Apr 22, 2026 - Tribhuven Bisen
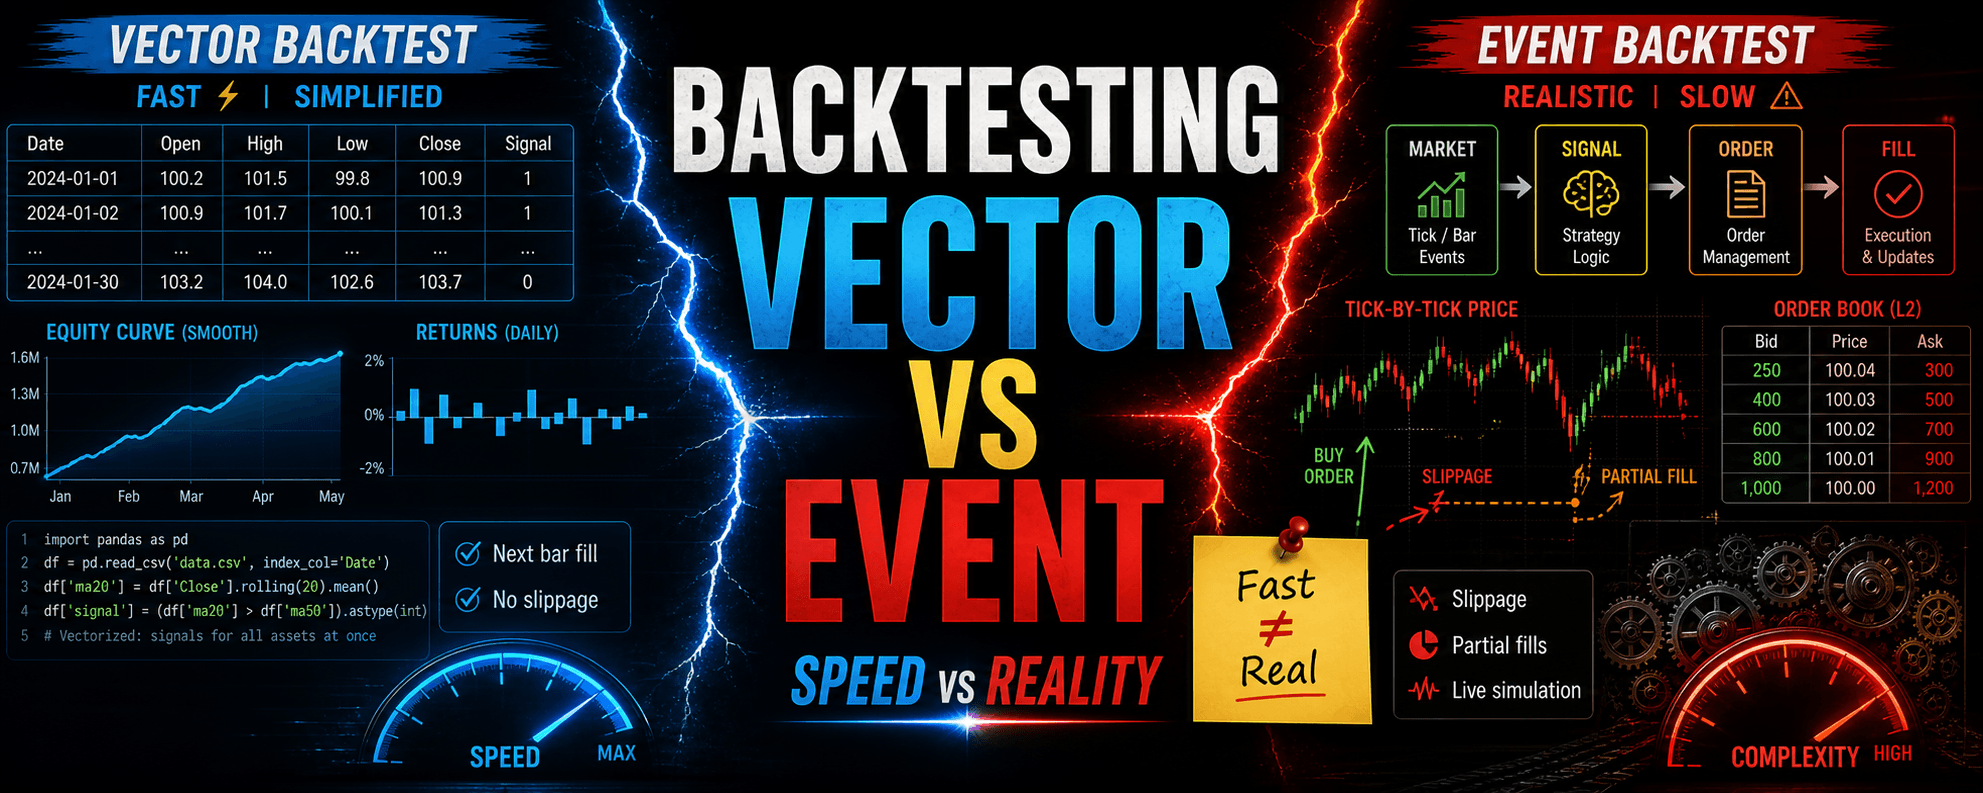
Vector-based backtesting is fast but simplified, while event-based backtesting is slower but more realistic, with the choice depending on strategy complexity and time horizon.
Backtesting Paradigms: Vector-Based vs Event-Based
Summary
Backtesting evaluates a trading strategy using historical data. Two paradigms exist: Vector-Based Backtesting, which processes data in fixed time-step batches (e.g., daily or minute bars) and uses vectorized operations to compute signals across all assets simultaneously, and Event-Based Backtesting, which simulates a live environment by sequentially handling discrete market data events (ticks, bar closes, etc.) in an event loop. Vector-based frameworks are fast and simple, suited for rapid prototyping and low-frequency strategies, but they assume fills at the next bar's open or close and ignore intra-bar details (slippage, partial fills, bid-ask spreads). Event-based frameworks are more complex and computationally intensive but provide higher fidelity by modeling realistic order types, slippage, partial fills, and real-time risk checks. They also facilitate a smoother production transition. The choice depends on strategy time horizon, execution complexity, and data availability.
1. Overview of Backtesting Paradigms
1.1 What Is Backtesting?
Backtesting applies a trading strategy's rules to historical market data to estimate performance—returns, drawdowns, and risk metrics—as if the strategy had run live. It is essential for validating logic before deploying capital.
1.2 Two Core Paradigms
- Vector-Based Backtesting: Processes entire price series at set time intervals (daily or minute bars), computing indicators, signals, and rebalances in batch—often at bar close or next bar open.
- Event-Based Backtesting: Simulates a real-time trading environment by sequentially handling discrete market data events (ticks, bar closes, news) in an event loop; strategy, portfolio, and execution modules react to each event in chronological order.
2. Mechanics of Vector-Based Backtesting
2.1 Fixed Time-Step Processing
Historical data is loaded into arrays or dataframes where each row is a fixed interval (one day or one minute) and each column is an asset's price or indicator series. At each bar , indicators are computed via vectorized operations (e.g., pandas' .rolling(), NumPy functions) up to .
2.2 Signal Generation and Position Updates
At bar , the strategy applies logic such as moving-average crossovers or mean-reversion tests using vectorized calculations (e.g., price.rolling(window=20).mean()) to decide long, short, or flat for the next bar. All signals for all assets are computed simultaneously. The engine then issues hypothetical market orders filled at the next bar's open or close, rebalancing positions in a single batch.
2.3 Practical Implementation Steps
- Data Preprocessing: Load adjusted OHLCV data into a pandas DataFrame indexed by timestamp. Apply corporate-action adjustments correctly to avoid look-ahead bias.
- Indicator Calculation: Use pandas' vectorized functions—
.rolling(),.ewm()—to derive technical indicators (moving averages, RSI, Bollinger Bands) for each asset in one pass. - Signal Matrix Construction: Compare indicator columns (e.g., 20-period MA vs. 50-period MA) to produce +1 (long), −1 (short), or 0 (flat) signals for each asset, forming a signals DataFrame parallel to the price DataFrame.
- Portfolio Rebalancing: Multiply the signals by a position-sizing rule (fixed-dollar allocation or volatility scaling) to determine target position sizes. Simulate fills at the next bar's open or close without modeling intra-bar order book dynamics.
- P&L and Risk Metrics: Compute returns by comparing executed prices (next bar) to current prices. Aggregate daily P&L, apply uniform transaction costs (fixed commission per share), and generate equity curves, drawdowns, and other statistics.
2.4 Strengths of Vector-Based Approaches
- High Computational Efficiency: Vectorized operations run in parallel (SIMD/BLAS), enabling rapid backtests on large universes (hundreds of assets, millions of rows).
- Simplicity of Implementation: A single pass over bars (or even fully vectorized code) suffices—indicators, signals, and rebalances use DataFrame operations. This minimizes boilerplate for developers using pandas and NumPy.
- Well-Suited for Low-Frequency Research: When strategies trade daily or weekly using end-of-day pricing, vectorized backtests yield accurate results for factor research or cross-sectional studies.
2.5 Key Limitations and Pitfalls
- Look-Ahead Bias and Data Snooping: If indicator windows or signal logic reference future bars (e.g.,
df.shift(-1)), performance becomes artificially inflated. Off-by-one indexing errors occur easily in vectorized code. - Unrealistic Execution Assumptions: Assuming fills at the next bar's open or close ignores intra-bar price moves, bid-ask spreads, and partial fills. Strategies requiring limit or stop orders cannot be simulated faithfully.
- Inability to Handle Path Dependencies: Complex money-management rules—trailing stops based on intra-bar highs/lows or dynamic sizing based on realized P&L—cannot be implemented accurately when each bar is treated as a single event.
- Limited Intraday Risk Controls: Risk checks (intraday margin calls, real-time VaR limits) cannot be enforced mid-bar; the model only reevaluates at bar boundaries.
2.6 Sample Code: Vector-Based Backtesting (Python)
import pandas as pd

# 1. Load historical data into a DataFrame
#    Index: DateTime; Columns: ['AssetA', 'AssetB', ...]
prices = pd.read_csv('historical_prices.csv', index_col='date', parse_dates=True)

# 2. Compute indicators vectorized
ma_short = prices['AssetA'].rolling(window=20).mean()  # 20-bar moving average
ma_long  = prices['AssetA'].rolling(window=50).mean()  # 50-bar moving average

# 3. Generate signals
signals = pd.DataFrame(index=prices.index)
signals['signal'] = 0
signals['signal'][ma_short > ma_long] =  1   # Go long when 20-MA > 50-MA
signals['signal'][ma_short < ma_long] = -1   # Go short when 20-MA < 50-MA

# 4. Shift signals to simulate next-bar execution
positions = signals['signal'].shift(1)

# 5. Compute bar returns
returns = prices['AssetA'].pct_change()

# 6. Calculate strategy returns
strategy_returns = positions * returns
equity_curve = (1 + strategy_returns).cumprod()

# 7. (Optional) Apply transaction costs
#    cost_per_trade = 0.001  # 0.1%
#    trade_count = (positions != positions.shift(1)).sum()
#    total_cost = trade_count * cost_per_trade
3. Mechanics of Event-Based Backtesting
3.1 Event Loop Architecture
Event-based frameworks use a chronological event queue. The core loop processes events in order:
- Market Data Event: New bar or tick arrives (trade, quote, or bar close).
- Signal Event: Strategy logic consumes the market data and, if conditions match, emits a signal (e.g., "Buy 100 XYZ at market").
- Order Event: Portfolio/Execution handler translates signals into orders (market, limit, stop), specifying type, size, and price.
- Fill Event: Broker simulator matches orders against market data (bid-ask, available volume) and issues partial/full fills at realistic prices.
- Update Event: Portfolio updates positions, cash, and risk metrics; may generate risk alarms (margin calls, forced liquidations).
- Performance Recording: Each fill triggers P&L calculations, slippage accounting, and is logged for performance analysis.
Market data is introduced only when available, avoiding look-ahead bias and enabling realistic execution simulation.
3.2 Component Breakdown
Market Data Handler: Streams historical tick or bar data into the event queue chronologically. Prevents look-ahead by releasing data only when appropriate.
Strategy Module: Subscribes to data events. Maintains internal state (e.g., rolling indicators updated incrementally) and emits signal events when conditions are met (e.g., price crosses above a moving average).
Portfolio/Execution Handler: Receives signal events and creates order events (market, limit, stop). Manages cash, positions, and risk exposure, enforcing predefined risk limits (e.g., maximum notional exposure).
Broker/Exchange Simulator: Processes order events by matching them against market data (quotes or reconstructed order book). Models realistic slippage, partial fills, and commissions, issuing fill events back to the portfolio.
Risk & Compliance Module: Monitors limits such as intraday VaR, position caps, and short-sale constraints. Triggers forced liquidations or cancels orders if thresholds are breached.
Performance Recorder: Logs each fill event—timestamp, fill price, quantity, slippage, commission—for post-mortem analysis and performance metrics calculation.
3.3 Practical Implementation Steps
- Data Ingestion: Load tick or bar data into a time-ordered event queue (e.g.,
collections.deque). - Initialize Components: Instantiate DataHandler, Strategy, PortfolioHandler, BrokerSimulator, and PerformanceTracker, wiring them via a central event bus.
- Event Loop Execution:
- If the queue is empty, the data handler enqueues the next market data event.
- Dequeue the next event:
- Market Data Event: Call
Strategy.on_market_data()(may emit signal events) andPortfolio.on_market_data()(may emit order events). - Signal Event: Call
Portfolio.on_signal()to generate order events, which are enqueued. - Order Event: Call
Broker.execute_order()to simulate fills, issuing fill events back into the queue. - Fill Event: Call
Portfolio.on_fill()to update positions and cash, thenPerformanceTracker.on_fill()to log P&L, slippage, and commissions.
- Market Data Event: Call
- Repeat until data is exhausted and the queue is empty.
- Post-Processing: Aggregate fill-level logs into performance metrics—Sharpe ratio, maximum drawdown, turnover—once the backtest completes.
3.4 Sample Code: Event-Based Backtesting (Python)
from collections import deque
import abc

# Event base classes
class Event:
    pass

class MarketEvent(Event):
    def __init__(self, symbol, timestamp, price):
        self.type = 'MARKET'
        self.symbol = symbol
        self.timestamp = timestamp
        self.price = price

class SignalEvent(Event):
    def __init__(self, symbol, timestamp, signal_type, quantity):
        self.type = 'SIGNAL'
        self.symbol = symbol
        self.timestamp = timestamp
        self.signal_type = signal_type  # 'LONG' or 'SHORT'
        self.quantity = quantity

class OrderEvent(Event):
    def __init__(self, symbol, order_type, quantity, price=None):
        self.type = 'ORDER'
        self.symbol = symbol
        self.order_type = order_type  # 'MARKET', 'LIMIT', 'STOP'
        self.quantity = quantity
        self.price = price  # For limit/stop orders

class FillEvent(Event):
    def __init__(self, symbol, timestamp, fill_price, quantity, commission):
        self.type = 'FILL'
        self.symbol = symbol
        self.timestamp = timestamp
        self.fill_price = fill_price
        self.quantity = quantity
        self.commission = commission

# Abstract handler interfaces
class DataHandler(abc.ABC):
    @abc.abstractmethod
    def get_next_market_event(self):
        raise NotImplementedError

class Strategy(abc.ABC):
    @abc.abstractmethod
    def on_market_event(self, event):
        raise NotImplementedError

class Portfolio(abc.ABC):
    @abc.abstractmethod
    def on_signal(self, signal):
        raise NotImplementedError

    @abc.abstractmethod
    def on_fill(self, fill):
        raise NotImplementedError

class Broker(abc.ABC):
    @abc.abstractmethod
    def execute_order(self, order):
        raise NotImplementedError

# Simple implementations
class HistoricalCSVDataHandler(DataHandler):
    def __init__(self, event_queue, csv_file):
        self.event_queue = event_queue
        self.data = self._load_csv(csv_file)
        self.index = 0

    def _load_csv(self, file):
        import pandas as pd
        df = pd.read_csv(file, parse_dates=['timestamp'])
        df.sort_values('timestamp', inplace=True)
        return df.to_dict('records')

    def get_next_market_event(self):
        if self.index < len(self.data):
            row = self.data[self.index]
            event = MarketEvent(
                symbol=row['symbol'],
                timestamp=row['timestamp'],
                price=row['price']
            )
            self.index += 1
            return event
        else:
            return None

class MovingAverageCrossStrategy(Strategy):
    def __init__(self, data_handler, short_window=20, long_window=50):
        self.data_handler = data_handler
        self.short_window = short_window
        self.long_window = long_window
        self.prices = {}
        self.signals = deque()

    def on_market_event(self, event):
        symbol = event.symbol
        price = event.price
        # Append price to history
        if symbol not in self.prices:
            self.prices[symbol] = []
        self.prices[symbol].append(price)
        # Only generate signals after long_window prices
        if len(self.prices[symbol]) >= self.long_window:
            short_ma = sum(self.prices[symbol][-self.short_window:]) / self.short_window
            long_ma  = sum(self.prices[symbol][-self.long_window:])  / self.long_window
            if short_ma > long_ma:
                signal = SignalEvent(symbol, event.timestamp, 'LONG', 100)
                self.signals.append(signal)
            elif short_ma < long_ma:
                signal = SignalEvent(symbol, event.timestamp, 'SHORT', 100)
                self.signals.append(signal)

    def get_signals(self):
        signals = list(self.signals)
        self.signals.clear()
        return signals

class SimplePortfolio(Portfolio):
    def __init__(self, event_queue, initial_capital=100000):
        self.event_queue = event_queue
        self.initial_capital = initial_capital
        self.cash = initial_capital
        self.positions = {}

    def on_signal(self, signal):
        order = None
        if signal.signal_type == 'LONG':
            order = OrderEvent(signal.symbol, 'MARKET', signal.quantity)
        elif signal.signal_type == 'SHORT':
            order = OrderEvent(signal.symbol, 'MARKET', -signal.quantity)
        return order

    def on_fill(self, fill):
        qty = fill.quantity
        cost = fill.fill_price * qty
        self.cash -= cost + fill.commission
        self.positions[fill.symbol] = self.positions.get(fill.symbol, 0) + qty

class SimulatedBroker(Broker):
    def __init__(self, event_queue):
        self.event_queue = event_queue

    def execute_order(self, order):
        # Assume immediate fill at last known price minus 1 tick slippage
        fill_price = order.price if order.price else 100.0  # placeholder
        commission = 1.0  # flat commission
        fill = FillEvent(
            symbol=order.symbol,
            timestamp="now",  # placeholder
            fill_price=fill_price,
            quantity=order.quantity,
            commission=commission
        )
        return fill

# Main event loop
def backtest(event_queue, data_handler, strategy, portfolio, broker):
    # Prime the data handler
    market_event = data_handler.get_next_market_event()
    if market_event:
        event_queue.append(market_event)

    while event_queue:
        event = event_queue.popleft()
        if isinstance(event, MarketEvent):
            strategy.on_market_event(event)
            signals = strategy.get_signals()
            for signal in signals:
                event_queue.append(signal)
        elif isinstance(event, SignalEvent):
            order = portfolio.on_signal(event)
            if order:
                event_queue.append(order)
        elif isinstance(event, OrderEvent):
            fill = broker.execute_order(event)
            event_queue.append(fill)
        elif isinstance(event, FillEvent):
            portfolio.on_fill(event)
            # Fetch next market event if queue is empty
            if not event_queue:
                next_event = data_handler.get_next_market_event()
                if next_event:
                    event_queue.append(next_event)

if __name__ == "__main__":
    from collections import deque
    event_queue = deque()
    data_handler = HistoricalCSVDataHandler(event_queue, 'historical_tick_data.csv')
    strategy  = MovingAverageCrossStrategy(data_handler)
    portfolio = SimplePortfolio(event_queue, initial_capital=100000)
    broker    = SimulatedBroker(event_queue)
    backtest(event_queue, data_handler, strategy, portfolio, broker)
    # After completion, analyze portfolio.cash and portfolio.positions
4. Practical Strengths and Trade-Offs
4.1 Speed and Scalability
- Vector-Based: A multi-asset, daily-rebalancing vectorized backtest (e.g., 500 tickers over 10 years of daily data) completes in under one second on a modern workstation, thanks to optimized NumPy/pandas routines.
- Event-Based: Simulating minute-level data for the same universe (500 symbols × 2,500 trading days × 390 minutes ≈ 487 million data points) can take 15–30 minutes, even with optimized Cython or PyPy code. Tick-level simulations (millions of ticks per symbol) may require hours or distributed computing.
4.2 Data Storage and Preprocessing
- Vector-Based: Requires only bar-level OHLCV data (daily or minute). Storage is modest—few gigabytes for multi-year minute data—and preprocessing focuses on corporate actions and basic cleaning.
- Event-Based: Requires tick or sub-bar data (trades and quotes), with storage volumes often reaching terabytes for multi-year, multi-asset archives. Preprocessing involves reconstructing order books, filtering bad ticks, and merging multiple feeds, usually using specialized databases (kdb+, Parquet, etc.).
4.3 Order Types and Execution Fidelity
- Vector-Based: Essentially limited to market orders at next bar open or close. Simulating limit orders, OCO, or stops requires heuristics (checking bar high/low), but cannot model partial fills or depth-of-book effects accurately.
- Event-Based: Supports market, limit, stop, stop-limit, iceberg, and custom TWAP/VWAP algorithms. Orders are matched against tick-level quotes or reconstructed order books, enabling realistic slippage, partial fills, and volume-based execution cost modeling.
4.4 Risk Management Fidelity
- Vector-Based: Risk constraints—maximum drawdown, volatility caps, position size limits—are enforced only at bar close. Intraday breaches (e.g., a 2% intraday drop triggering liquidation) are missed until the next bar.
- Event-Based: Enables mid-bar risk checks: if a fill or price tick breaches risk limits (margin calls, stop-loss), the system can issue forced liquidations or cancel orders immediately, mirroring live trading constraints.
4.5 Strategy Complexity and Path Dependencies
- Vector-Based: Recursive features—trailing stops based on intra-bar highs/lows, dynamic sizing based on realized P&L—are difficult because bars are processed as atomic events.
- Event-Based: Naturally handles path dependencies by updating indicators and portfolio state on each event. For instance, a trailing stop adjusting to a high-water mark as ticks arrive can be coded directly within the event logic.
5. Avoiding Common Pitfalls
5.1 Look-Ahead Bias in Vectorized Backtests
Definition: Look-ahead bias happens when future information inadvertently influences past signal generation. For example, using adjusted prices that "know" about splits or dividends before they occur inflates performance.
Mitigation:
- Use raw price series and apply corporate-action adjustments only at or after the ex-date.
- Ensure indicator calculations reference only past bars (e.g.,
df['close'].shift(1)) when generating signals for day to execute on day . - Validate code by inspecting windows around known corporate actions to confirm correct alignment.
5.2 Incorrect Bar Offset and Signal Lag
Issue: If signals are generated on bar and executed on the same bar's close, you implicitly assume knowledge of that close price before it is available.
Mitigation: Always shift signals by one bar (e.g., signals = signals.shift(1)) so execution on bar uses only information available at bar .
5.3 Poorly Modeled Slippage and Partial Fills
Issue: Vector-based backtests often apply a flat slippage rate (e.g., 5 bps per trade) uniformly, ignoring volume, liquidity, and bid-ask dynamics, misrepresenting P&L in less liquid securities.
Mitigation:
- Incorporate a tiered slippage model: e.g., orders under 5% of ADV incur 1 bp slippage; orders between 5–10% of ADV incur 5 bps; orders above 10% incur 10 bps.
- Use event-driven testing where fills draw from real bid-ask data and volume profiles.
5.4 Event Loop Bottlenecks
Issue: Inefficient event queues become bottlenecks, slowing simulations over tick data significantly.
Mitigation:
- Use efficient data structures (e.g.,
collections.dequeorheapq) instead of a naïve Queue to manage millions of events. - Apply Cython or PyPy optimizations in critical functions (fill matching, risk checks) to reduce interpreter overhead.
- Batch-process events sharing the same timestamp (e.g., multiple quotes at time ) to cut Python loop overhead.
5.5 Inadequate Logging and Diagnostics
Issue: Without detailed logs of fills (timestamp, price, quantity, slippage, commission), diagnosing discrepancies between vectorized and event-driven results is difficult.
Mitigation:
- Implement a fill-log table to capture event ID, order type, fill price, fill quantity, timestamp, slippage, and commission.
- Post-mortem: Compare fill logs to raw market data to identify anomalous slippage or execution issues.
6. When to Choose Which Paradigm
6.1 Vector-Based Backtesting Suits
- High-Level Research: Testing factor models, cross-sectional strategies, or statistical analysis on monthly or daily data where intra-bar details are negligible.
- Rapid Prototyping: Iterating quickly over parameter grids (look-back windows, threshold levels) to identify promising designs before deeper testing.
- Limited Data Availability: When only end-of-day or minute-bar data is accessible and tick data is too costly or unavailable.
6.2 Event-Based Backtesting Suits
- Intra-Day & High-Frequency Strategies: When rapid reaction to price changes, order-book dynamics, or cross-asset arbitrage opportunities within seconds or milliseconds is essential.
- Complex Order Logic: Strategies requiring limit orders, iceberg orders, TWAP/VWAP execution, or adaptive sizing need event-driven execution for realistic partial fills and slippage modeling.
- Institutional-Grade Infrastructure: For code intended to transition into a live trading system, event-driven frameworks allow swapping historical data feeds for live broker APIs and simulated brokers for real execution engines.
- Dynamic Risk Management: Strategies constrained by intraday margin requirements or real-time VaR limits can enforce rules mid-bar only in an event-driven system.
7. Summary of Key Trade-Offs
| Factor | Vector-Based | Event-Based |
|---|---|---|
| Core Loop | Fixed time-step loop (daily/minute bars) | Event-driven loop (market data to signals to orders to fills) |
| Execution Granularity | Bar-level only (one price per bar) | Tick- or intra-bar level, modeling bid-ask and volume |
| Order Types Supported | Market orders at next bar open/close; limited stop/limit simulation via bar high/low checks | Market, limit, stop, stop-limit, iceberg, TWAP, VWAP, OCO |
| Slippage Modeling | Post-hoc flat slippage assumptions or simple tiers | Dynamic slippage from bid-ask data, volume, order-book depth |
| Realism | Lower fidelity (assumes synchronized bar rebalances, no intra-bar execution nuances) | Higher fidelity (simulates realistic fills, partial fills, asynchronous signals) |
| Speed & Scalability | Very fast (seconds for decades of data across hundreds of symbols via vectorization) | Slower (minutes to hours for minute/tick data via event loops) |
| Code Complexity | Simple (few hundred lines, DataFrame operations) | Complex (multi-module event loop, 500–1,000+ lines, intricate event/state management) |
| Data Requirements | OHLCV bars (daily or minute) | Tick or sub-minute data, order-book reconstruction, extensive cleaning |
| Risk Management Granularity | Bar-level only (risk checks at bar close) | Event-level (real-time risk checks, margin calls, intraday drawdown enforcement) |
| Fidelity to Production Systems | Limited (needs rewriting for live streaming data) | High (can often be reused in production with minimal changes) |
| Ideal Use Cases | Low-frequency, factor research, rapid prototyping | Intra-day, high-frequency, algorithmic execution, market-making, institutional infrastructure |
8. Concluding Remarks
Vector-based backtesting excels at rapid prototyping for low-frequency, bar-level strategies by leveraging optimized NumPy and pandas routines to compute P&L across the entire dataset in seconds. It is ideal for factor research or strategies where intra-bar dynamics are negligible. However, it risks look-ahead bias and cannot model realistic execution aspects—slippage, partial fills, bid-ask spreads—or enforce intraday risk controls.
Event-based backtesting provides a high-fidelity simulation of live trading: modeling tick-level updates, sequential event processing, realistic slippage, partial fills, and dynamic risk controls. This accuracy comes at the cost of greater complexity, more extensive data requirements (tick or sub-minute), and longer runtimes. Event-driven engines are essential for intra-day or execution-sensitive strategies—market-making, high-frequency trading, complex order logic—and facilitate a smoother transition from backtest code to production trading systems.
Many quant teams adopt a hybrid approach: using vectorized backtests to screen and narrow a universe of candidates, then migrating promising designs into an event-driven framework for final validation before live deployment. By understanding trade-offs among speed, realism, data requirements, and strategy complexity, practitioners can tailor their backtesting infrastructure to meet research, development, and production needs effectively.