Non-Linear Alpha Signal Ranking (NLASR)
Apr 22, 2026 - Tribhuven Bisen
A Comprehensive Framework for Alpha Aggregation
Non-Linear Alpha Signal Ranking (NLASR)
A Comprehensive Framework for Alpha Aggregation
Quant Insider April 21, 2026
1 Introduction
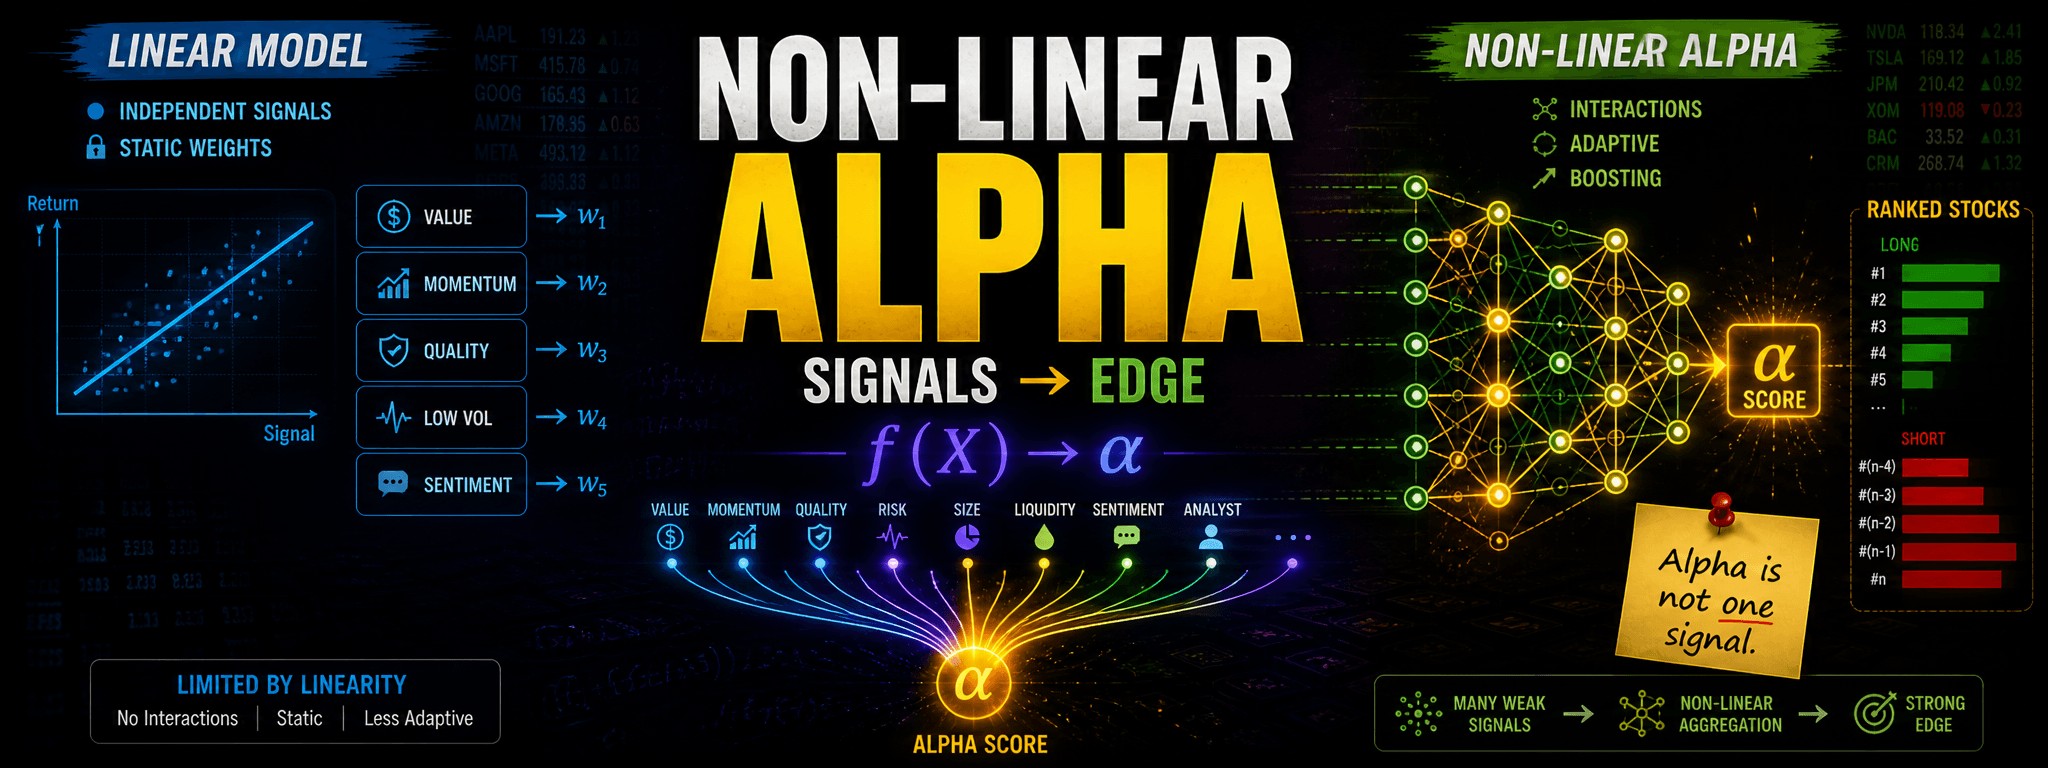
Modern quantitative equity strategies rely on extracting predictive signals from a large and diverse set of features. Individually, these signals tend to have low signal-to-noise ratios, but collectively they can produce meaningful alpha.
Non-Linear Alpha Signal Ranking (NLASR) is a machine learning-based framework designed to:
- Aggregate a large number of weak signals into a unified alpha score
- Capture non-linear interactions across factors
- Adapt dynamically to changing market regimes
- Improve robustness and diversification in stock selection
The key philosophy is that alpha is not concentrated in a single signal, but distributed across many weak, unstable predictors.
2 Core Idea: From Linear to Non-Linear Alpha Aggregation
Traditional factor models assume a linear structure:
This approach implicitly assumes:
- Factor independence
- Constant factor premia
- Linear contribution of each signal
However, empirical evidence suggests:
- Factor premia are time-varying
- Factor interactions are non-linear
- Signal effectiveness is regime-dependent
Hence, we require a mapping:
where is non-linear and adaptive.
3 Feature Library: The Alpha Factory
3.1 Philosophy
Instead of selecting a small number of "best" signals, NLASR adopts a feature abundance approach, often referred to as a "kitchen sink" methodology.
3.2 Feature Categories
-
Valuation Signals:
- Book-to-price, earnings yield
- Capture long-term mispricing
-
Momentum Signals:
- Price momentum (12-1, residual)
- Reflect behavioral biases and underreaction
-
Quality Signals:
- Profitability, margins, earnings stability
- Capture fundamental strength
-
Risk Signals:
- Volatility, beta, drawdown metrics
- Capture risk premia
-
Balance Sheet Signals:
- Leverage, liquidity, capital structure
-
Alternative Data Signals:
- Sentiment (news, social media)
- Analyst revisions
- Corporate activity
3.3 Insight
Each signal:
- Has low standalone predictive power
- Works only in certain regimes
- Contains noisy but valuable information
Key Insight: The goal is not to find perfect signals, but to combine imperfect signals intelligently.
4 Data Preprocessing and Normalization
Features are standardized cross-sectionally:
4.1 Why this matters
- Removes scale differences
- Ensures comparability across signals
- Prevents dominance of high-variance features
5 Boosting Framework
5.1 Motivation
Boosting converts weak learners into a strong learner by sequentially focusing on difficult observations.
5.2 Model Structure
5.3 Interpretation in Alpha Context
- : weak signal (factor or transformation)
- : importance of signal in current environment
5.4 Key Insight
Boosting naturally performs:
- Feature selection
- Non-linear interaction modeling
- Dynamic weighting of signals
6 Non-Linearity and Interaction Effects
6.1 Why Non-Linearity Matters
Financial signals rarely operate independently.
Example:
- Momentum works only when volatility is low
- Value works after market stress
This implies:
6.2 How NLASR Captures This
- Sequential reweighting
- Implicit feature interactions
- Conditional decision boundaries
7 Factor Momentum: A Critical Layer
7.1 Concept
Factors themselves exhibit persistence:
7.2 Practical Insight
- Momentum factor dominates in trending markets
- Value factor dominates in recovery phases
7.3 Implication
The model must:
- Increase weight on winning factors
- Reduce weight on losing factors
Boosting achieves this naturally.
8 Training Methodology
8.1 Multi-Horizon Training
Models are trained on multiple windows:
- Short-term: captures recent trends
- Medium-term: captures cyclical behavior
- Long-term: captures structural relationships
8.2 Insight
This creates:
- Model diversification
- Regime robustness
8.3 Avoiding Overfitting
- Time-series cross-validation
- Out-of-sample validation
- Regularization in boosting
9 Alpha Score Construction
Final alpha score:
9.1 Interpretation
- High score → strong expected outperformance
- Low score → expected underperformance
9.2 Ranking
10 Portfolio Construction
10.1 Strategy Design
- Long top decile
- Short bottom decile
10.2 Enhancements
- Sector neutrality
- Beta neutrality
- Risk budgeting
10.3 Insight
The model does not predict absolute returns, but relative ranking.
11 Why NLASR Works
- Aggregates many weak signals → reduces noise
- Captures non-linear relationships
- Adapts to market regimes
- Exploits factor momentum
- Diversifies across signals
12 Limitations and Risks
- Data quality dependence
- Model complexity
- Reduced interpretability
- Risk of regime breakdown
13 Conclusion
NLASR represents a modern approach to alpha generation, shifting from static factor models to adaptive, data-driven frameworks. By combining a large feature library with a boosting-based architecture, it provides a scalable and robust solution for stock selection in complex market environments.